A collection of my work in both Social Research and Physics.
I hope that you find the contents interesting. I have tried to show the range of work I have been involved in in the last few years and the various techniques and approaches I have employed.
-
COVID-19 related deaths and deprivation
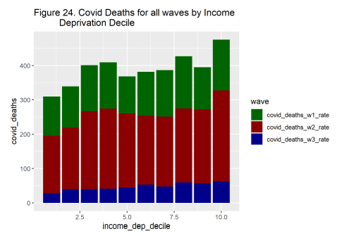
Throughout the COVID-19 pandemic data has been published of various metrics related to the virus, its spread and its impact on the population. Numerous studies have raised questions about the manner in which the impact of the spread of the virus has disproportionately affected groups in society. In this study I explored the relationship between…
-
Exploring the purpose and value of museums
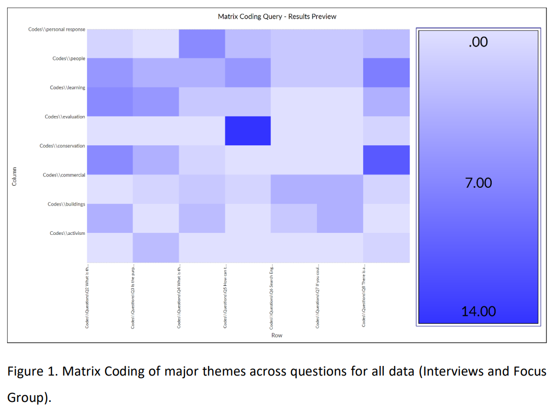
Observing the number of museums, their diversity, differences, similarities and changes over time raises an important series of questions. Why we have museums? What are they for and what value do they have? How might the value of museums be measured or captured? Working from these initial questions I designed and conducted qualitative research to…
-
Relationship between KS2APS and Progress 8
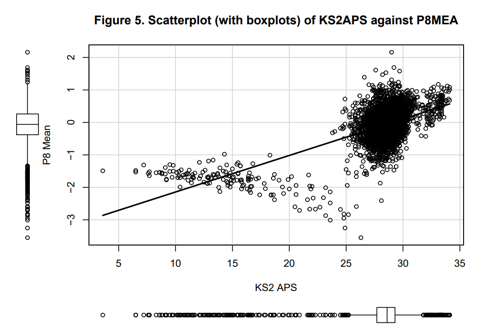
Progress 8 is a secondary school performance measure, designed to compare all of a schools’ pupils’ results with those of other pupils with a similar prior attainment. (Department for Education (DfE), 2016). Since Progress 8 was an attempt to address the perceived unfairness of the use of threshold measures, I wanted to explore the nature…
What are school ‘performance’ measures really measuring?
Secondary school performance measures play a central role in schools’ policy. They have an impact on parental choice, funding, the high stakes inspection process and the triggering of interventions. As such, they are widely assumed to be meaningful and accurate measures of school effectiveness.
To test some of these assumptions, we wanted to better understand what is meant by ‘performance’ within the headline secondary school performance measures. Using data for all mainstream secondary schools (for 2021-2022) downloaded from the DfE’s ‘Compare the performance of schools and colleges’ website, we used a range of analytical approaches to unpack the underlying features of schools which are represented in school performance measures.
Our findings bring attention to issues around some aspects of school performance measures:
- There are limitations to the breadth of the concept of ‘performance’, with the 6 headline measures representing just 4 factors related to student outcomes.
- Particular emphasis is placed upon ‘attainment’ within the performance metrics, with ‘attainment’ being measured by 3 out of the 6 headline measures.
- Factors related to the nature of the school (its ‘character’) and the school intake (its ‘context’), which, importantly, are not directly performance related, have a significant influence on ‘performance’ measures, in particular those 3 measures which represent ‘attainment’.
- Cluster analysis of school information metrics (not performance measures) gives insight into the challenges facing schools with different ‘characters’ and ‘contexts’ in their scores across the headline school performance measures.
Concept of ‘performance’ is limited
We used Exploratory Factor Analysis (EFA), a statistical approach used to reveal the underlying structure of a dataset, to discover more about the hidden factors, the ‘latent variables’, which shape the six headline secondary school performance measures. We found that the 6 metrics represent just 4 ‘performance’ factors: ‘attainment’, ‘progress’, ‘curriculum’ and ‘destinations’.
| Attainment (+ Destinations) | Progress | Curriculum | |
| Attain_8 | 0.857 | 0.413 | 0.299 |
| Progress_8 | 0.456 | 0.854 | 0.239 |
| Percent_EBacc_Entry | 0.291 | 0.183 | 0.831 |
| EBacc_APS | 0.783 | 0.37 | 0.491 |
| Basics | 0.819 | 0.389 | 0.307 |
| Destinations | 0.548 | 0.192 | 0.182 |
We also found that the 3 ‘attainment’ metrics, Attainment 8, ‘Basics’ and EBacc APS are all extremely strongly correlated with each other. This suggests that they are all measuring the same feature of schools, pointing to a degree of redundancy in the set of headline performance measures.
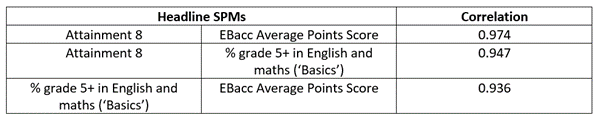
Correlations between Attainment 8, EBacc APS and ‘Basics’ SPMs
‘Attainment’ is prioritised in ‘performance’ measures
As we have already seen, half of the current headline secondary school performance measures represent just one factor, ‘attainment’. These measures fail to take into account students’ secondary school starting points (their key stage 2 test results) or any other factors which have been shown to influence students’ educational outcomes (e.g. disadvantage, special educational needs, English as an additional language).
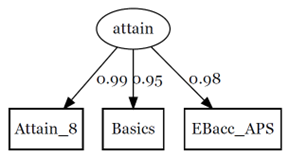
Confirmatory Factor Analysis (CFA) model for ‘attainment’ factor, showing high factor loadings for three performance metrics: Attainment 8, ‘Basics’ and EBacc Average Points Score
It could be argued that Progress 8 is, in practice, given the higher priority in terms of the interpretation and operation of school performance metrics. However, the presence of 3 ‘attainment’ metrics sends a strong signal of the high value of ‘attainment’ in school performance measurement. This will be even stronger when Progress 8 is not published in 2025 and 2026 as a consequence of the COVID-19 pandemic.
So, not only is there redundancy in the collection of performance metrics currently published, but they also place a particular emphasis on ‘attainment’ which, we will see, is strongly influenced by school ‘characters’ and the ‘contexts’ in which they work, not just school ‘performance’.
‘Performance’ measures are strongly influenced by factors not related to performance
Next, we constructed more complex statistical models using Structural Equation Modelling, a sophisticated statistical technique which allows the exploration of relationships between the published performance metrics and the underlying latent factors. This revealed the significant influence of schools’ ‘character’ (which, for this study captures whether it has a mixed or single gender intake and whether its admissions policy is selective) and ‘context’ (representing the features of the schools’ intakes) on school ‘performance’ measures.
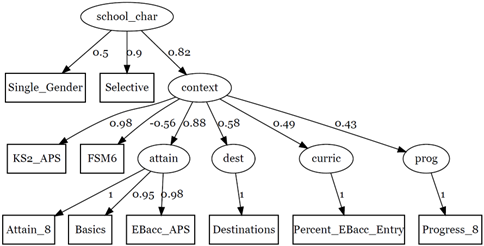
Structural Equation Model which shows the associations between latent variables of ‘school character’ and ‘school context’ and all four ‘performance’ factors
(‘attainment’, ‘destinations’, ‘curriculum’ and ‘progress’)
The factor loadings which form part of the output of this analysis suggest that over 75% of the variance in ‘attainment’ is explained by changes in school ‘context’. If ‘context’ changes, you can expect ‘attainment’, and the 3 performance measures which represent it, to change in a significant and predictable way.
Also, of note here are the lower factor loadings for the other factors (‘destinations’, ‘curriculum’ and ‘progress’). If we focus on ‘progress’ as represented by Progress 8, we find that just less than 20% of the variation in ‘progress’ is explained by variations in school ‘context’. ‘Context’ has a much smaller influence on Progress 8. However, what is significant here is that while the influence is smaller, ‘context’ still also affects Progress 8. This suggests that even for Progress 8 (which is widely considered to be the ‘fairest’ of the secondary school performance measures) any interpretation needs to carefully take into account school ‘context’. Failure to do so risks ignoring the bias from ‘context’ and ‘character’ which are baked into all of the performance metrics, including Progress 8, as we see next in the patterns revealed by cluster analysis.
It is probably worth emphasising at this stage that school ‘character’ and ‘context’ represent the nature of schools and their intakes. As such they cannot reasonably be considered to be direct measures of school effectiveness, i.e. of school ‘performance’. Despite this, they impact all of the secondary school performance measures, including Progress 8, but most significantly the 3 metrics representing ‘attainment’ (Attainment 8, ‘Basics’ and EBacc APS).
Schools with different ‘characters’ and ‘contexts’ can be at an advantage or disadvantage with regard to their headline school ‘performance’ measures
We used Cluster Analysis, a statistical technique used to group similar items or data points together, to further explore the influence of school ‘character’ and ‘context’ on schools’ performance measures. Using only variables for wider school information (metrics of school ‘character’ and ‘context’ not school ‘performance’) we discovered 4 clusters of schools. What was striking was that the 4 clusters, each representing schools grouped together because of the similarities in their ‘character’ and ‘context’, also, generally, had similarities in their school ‘performance’ measures.
For example, as shown below, Cluster 1 appears to be made up of 1415 schools which, in general, are at a disadvantage with regard to their ‘performance’ scores due to the challenges which they face.
Conversely, the ‘character’ and ‘context’ for the 1455 schools in Clusters 2 and 4 appears to put them, generally, at an advantage with regard to school ‘performance’ measures.
For the 255 schools in Cluster 3 the picture is more complex. Further examination of the way that the factors which shape Cluster 3 interact and influence the school performance may prove to be valuable in providing insight into the relationships between ‘non-performance’ and ‘performance’ metrics.
These findings suggest some potential for the use of this type of statistical segmentation approach to better understand the challenges facing schools and the impact of this on performance metrics. In doing so, this could support a more meaningful and accurate interpretation of school ‘performance’ measures.
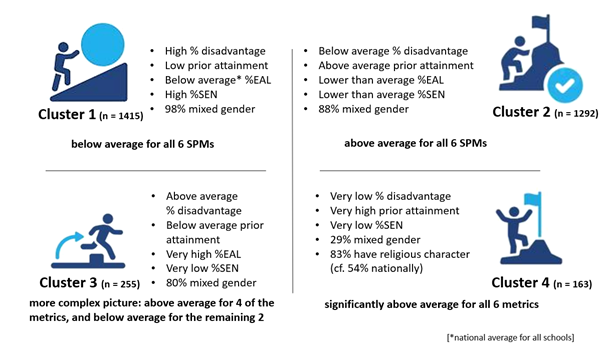
Features of the 4 clusters formed using hierarchical clustering using only wider school information variables (those associated with school ‘character’ and ‘context’ rather than ‘performance’)
In summary
This set of analyses raises some questions about both the breadth and emphasis of the existing secondary school headline performance measures. This will only be exacerbated by the reduction in the range of headline performance measures published in 2025 and 2026, from 5 to 6, with the removal of Progress 8 due to the impact of COVID-19.
It also shows that the measures which are presumed to represent school ‘performance’ are also shaped by school ‘non-performance’ related factors (which we conceptualise here as school ‘character’ and ‘context’). This is especially true for the metrics which dominate the collection of headline performance measures, those representing ‘attainment’.
But rather than focussing on the problems which these suggest with regard to the operation of school performance measures, let’s turn to the opportunities which this analysis presents.
First, awareness of the influence of factors beyond school ‘performance’ upon school performance measures can help us to interpret these metrics in more appropriate ways, cutting through any assumptions which might lead to, for example, flawed conclusions and ill-informed decisions. What is clear from this analysis is that these measures do appear to be representing various features of schools and these may well have some value for parents and students in making school choices and for schools leaders, governors, trustees, Ofsted inspectors and officials within the Department for Education to better understand schools. However, they should not be considered to be measures which purely and accurately reveal school performance. Perhaps we need to start calling them ‘headline school measures’ rather than ‘headline school ‘performance’ measures’?
Second, the limited breadth within the headline performance measures and the redundancy suggested by the inclusion of 3 measures representing the same ‘attainment’ factor can be seen as providing an opportunity to rebalance the collection of school metrics. This could be done by replacing 2 of the 3 ‘attainment’ measures with alternatives, adding breath and balance to the set of headline measures.
Finally, the various analyses used here suggest potential for their use in understanding the advantages and disadvantages, with regard to their ‘performance’ measures, which schools have as a result of their ‘character’ and ‘context’. Further development and evaluation of these approaches, using, for example, an even wider range of techniques and far larger datasets, could prove extremely valuable in making the measurement of school performance more accurate and meaningful.
-
COVID-19 related deaths and deprivation
Throughout the COVID-19 pandemic data has been published of various metrics related to the virus, its spread and its impact on the population. Numerous studies have raised questions about the manner in which the impact of the spread of the virus has disproportionately affected groups in society. In this study I explored the relationship between […]
-
Exploring the purpose and value of museums
Observing the number of museums, their diversity, differences, similarities and changes over time raises an important series of questions. Why we have museums? What are they for and what value do they have? How might the value of museums be measured or captured? Working from these initial questions I designed and conducted qualitative research to […]
-
Relationship between KS2APS and Progress 8
Progress 8 is a secondary school performance measure, designed to compare all of a schools’ pupils’ results with those of other pupils with a similar prior attainment. (Department for Education (DfE), 2016). Since Progress 8 was an attempt to address the perceived unfairness of the use of threshold measures, I wanted to explore the nature […]
Leave a Reply